libops Metrics
Your libops site services emits metrics that are aggregated and displayed on your libops Metrics dashboard. You can find the link to you dashboard at https://www.libops.io/user
Timing metrics
At the top of the metrics dashboard are metrics related to the number of requests and latency of those requests to your site, grouped by environment.
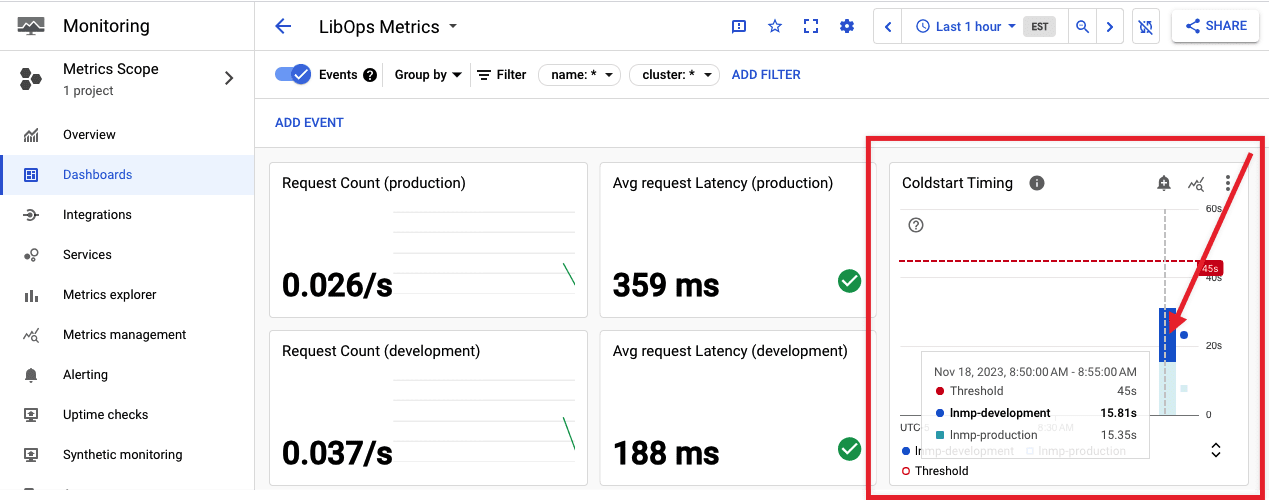
There's also a metric to record how long your environment takes to come online after a cold start. Keep in mind, cold starts only happen during a period of inactivity to your development environment (and also your production environment for sites not on a payment plan)

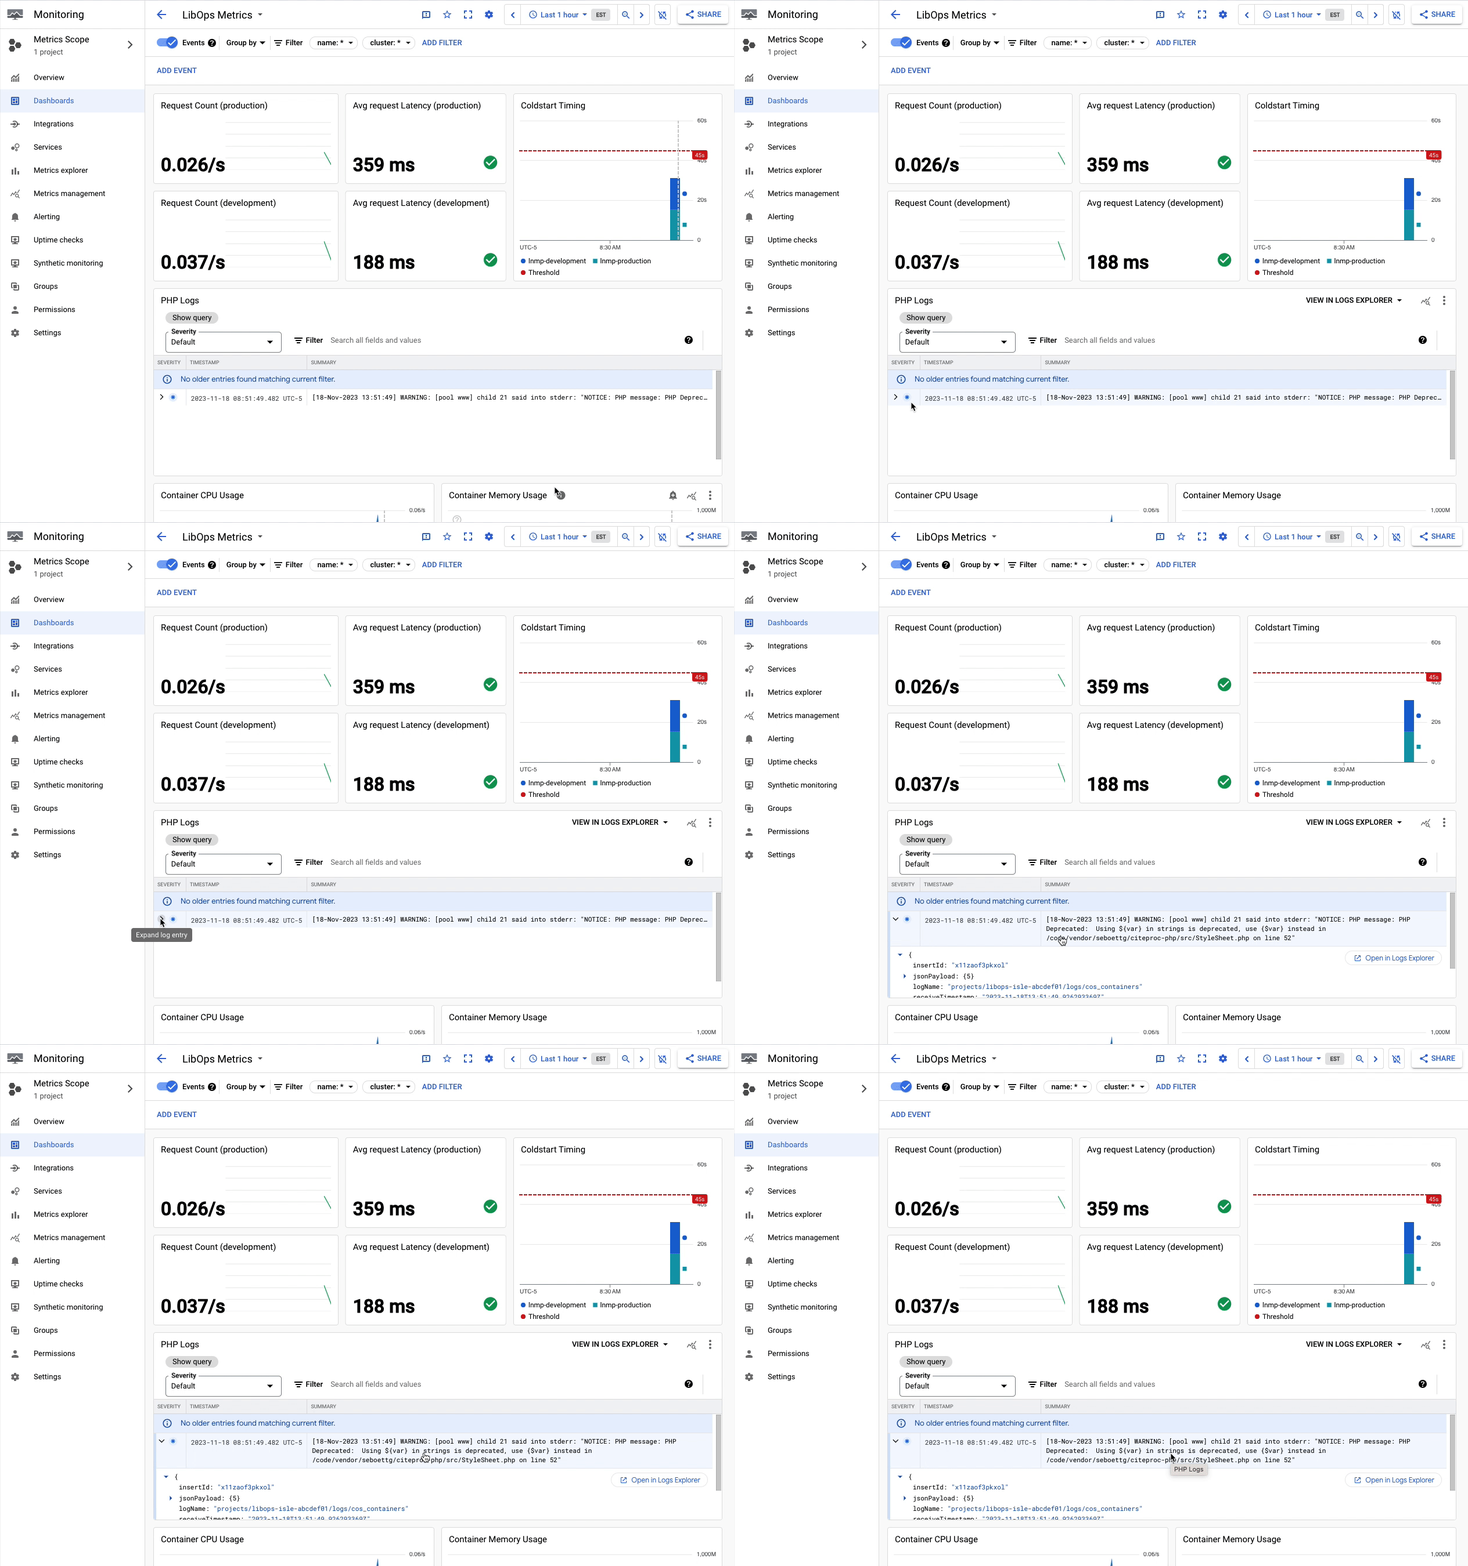
PHP Logs
The dashboard contains a filtered log view of any PHP errors that might be occurring on your site. There's also a link to the log explorer for further log analysis/troubleshooting.

Container metrics
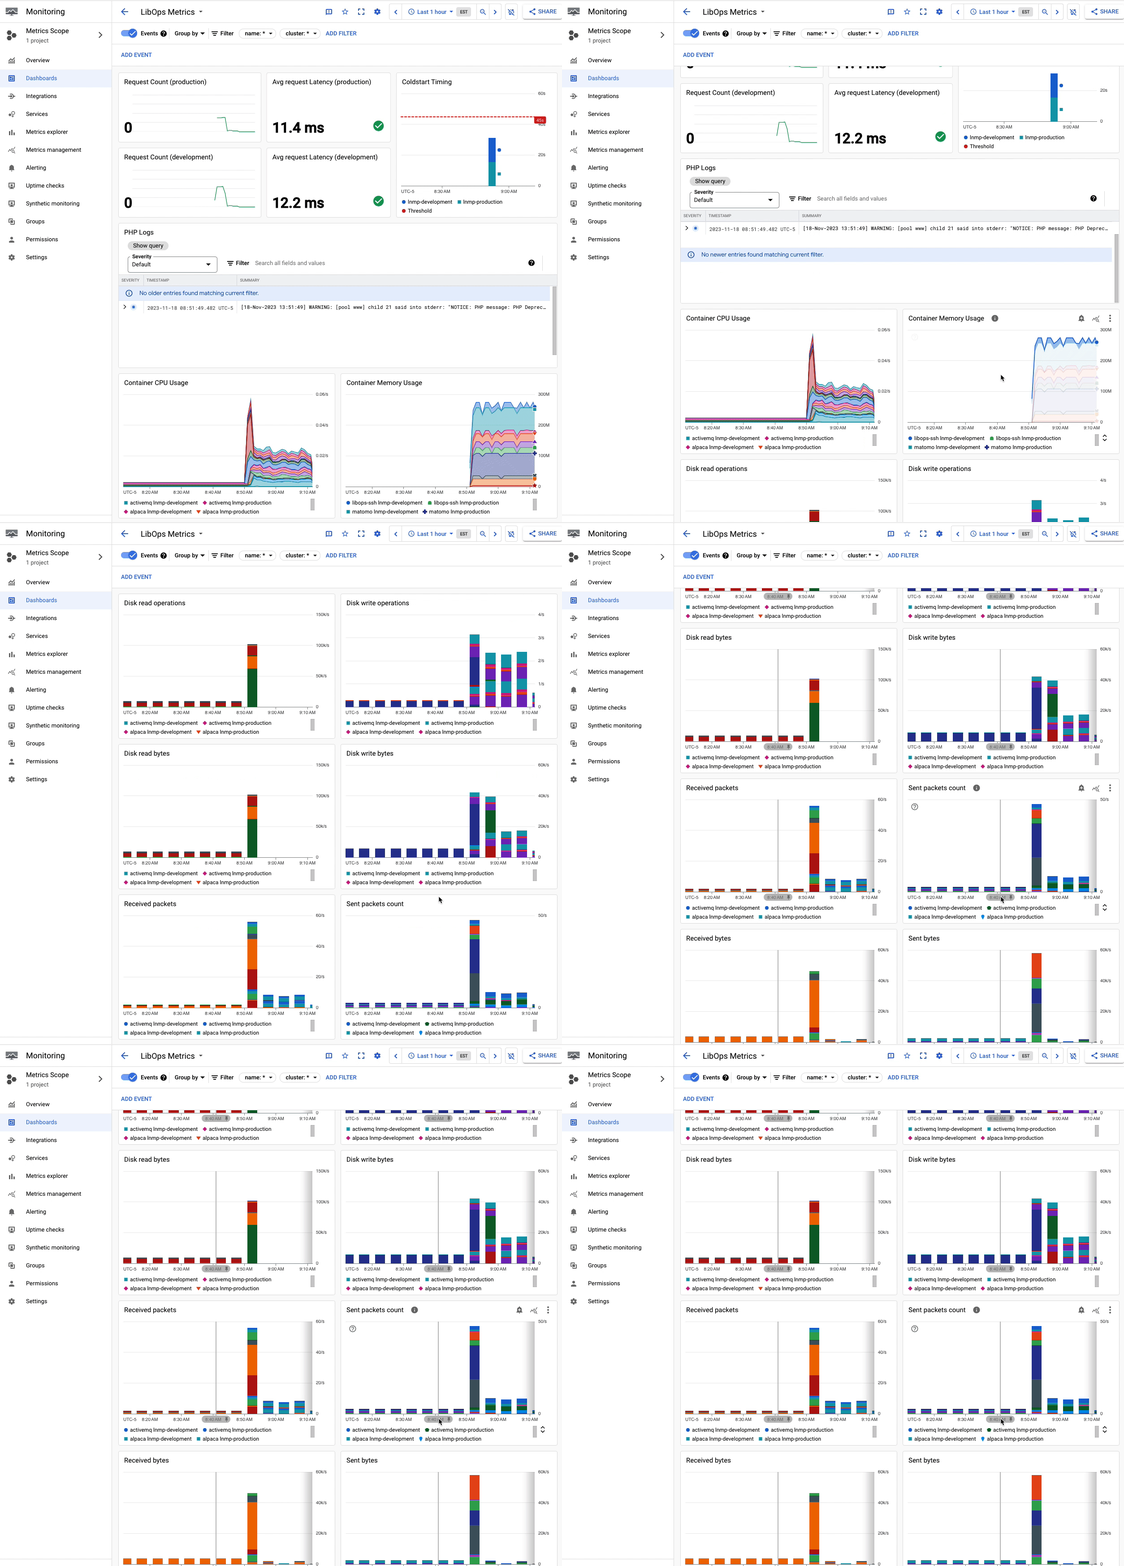
All of the services running on your libops envionrment have CPU, memory, i/o, and network metrics emitted. These metrics can be viewed as an aggregate of all environments and all containers

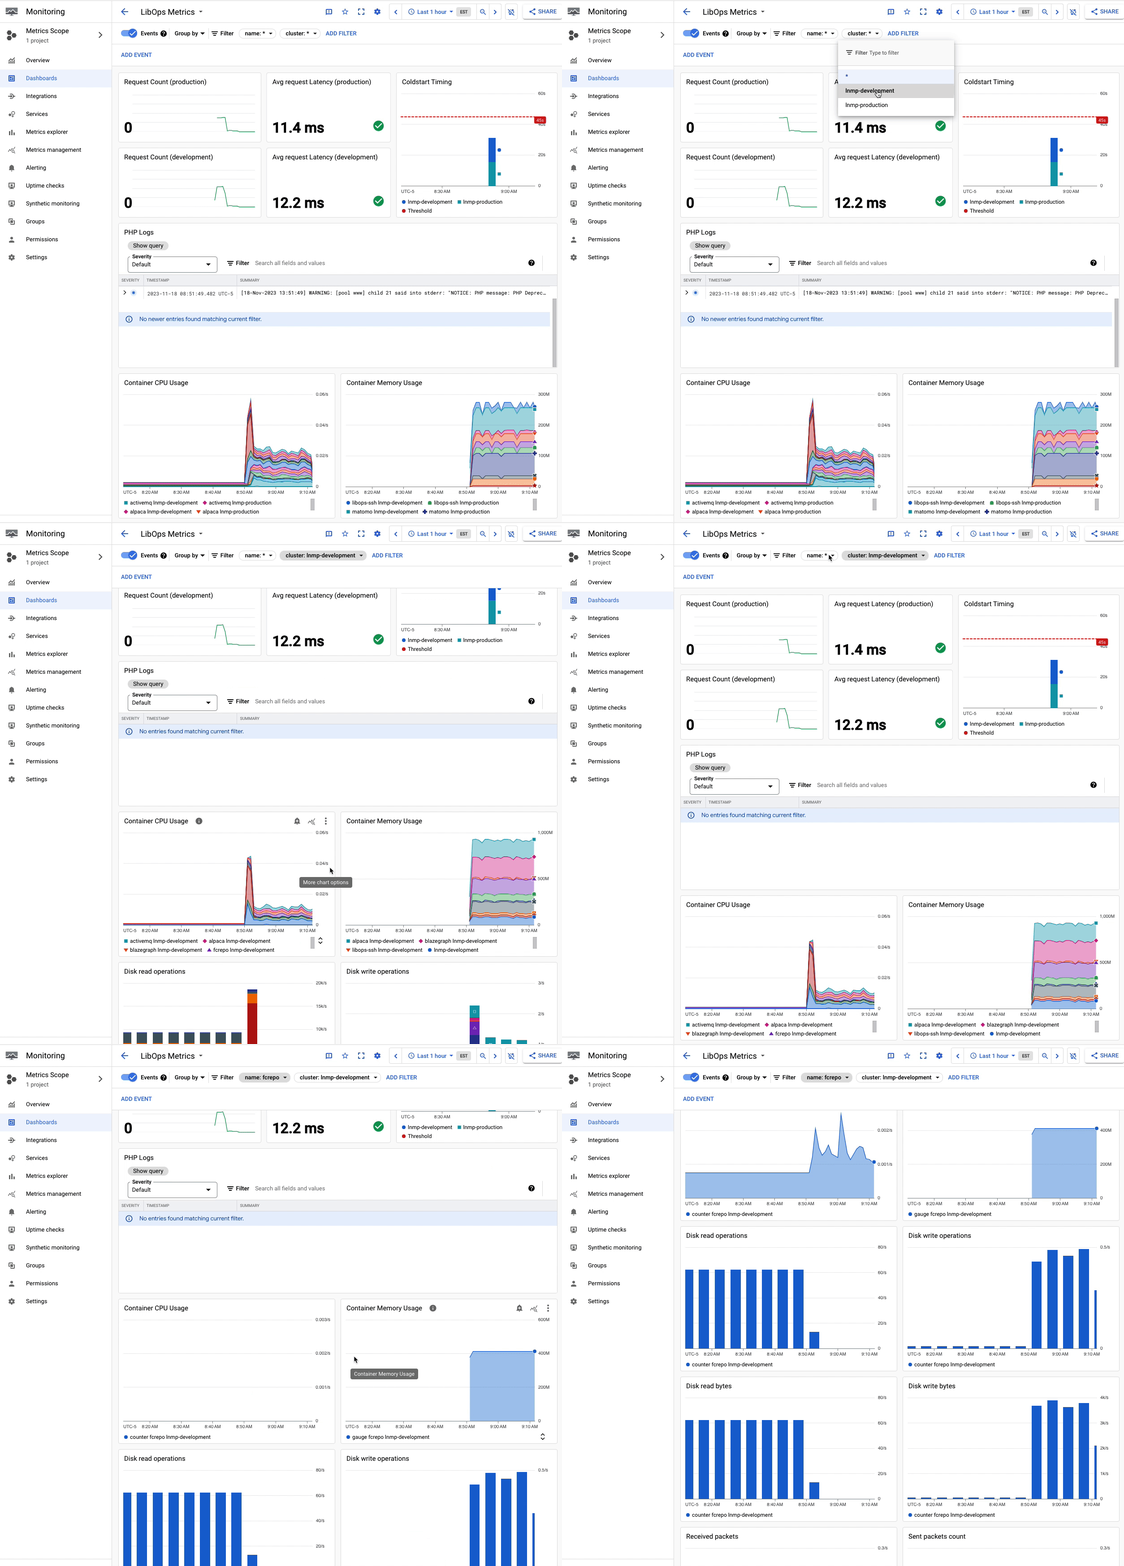
Filter container metrics
You also can filter which container metrics to view by selecting cluster to filter by a given libops environment and/or selectioning name to filter by a given service
